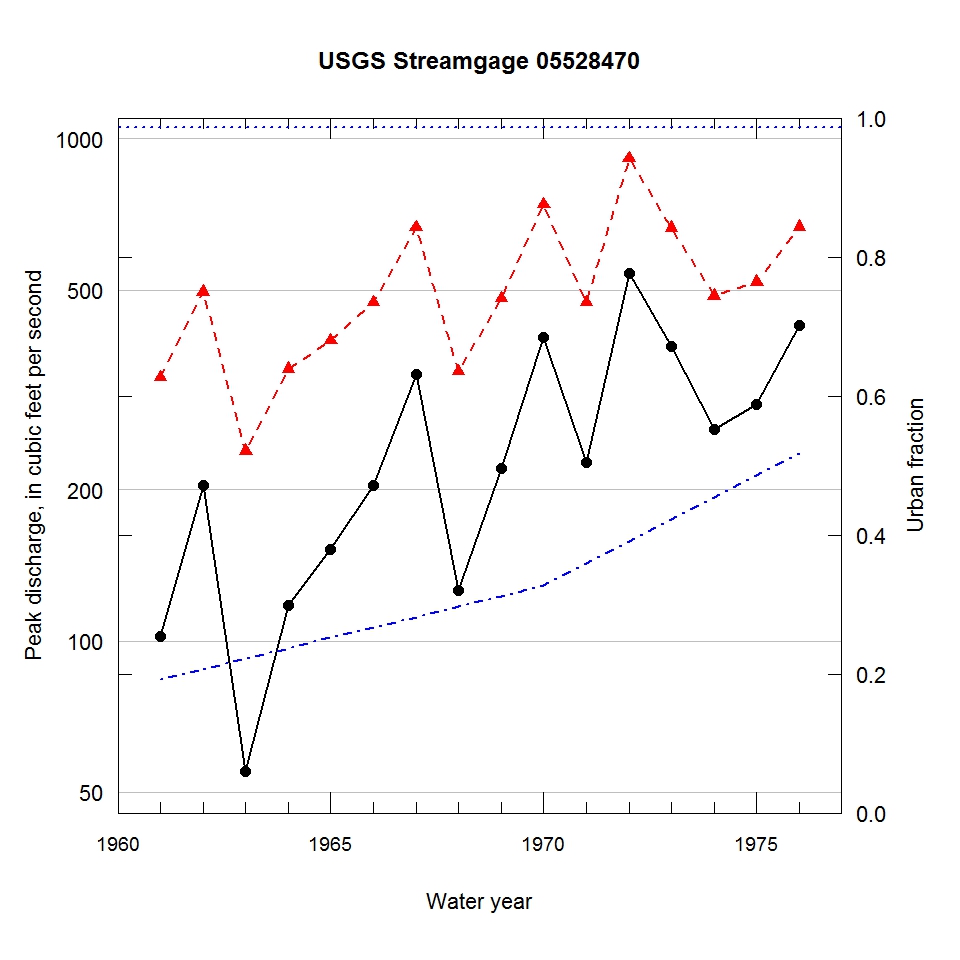
Observed and urbanization-adjusted annual maximum peak discharge and associated urban fraction and precipitation values at USGS streamgage:
05528470 BUFFALO CREEK AT LONG GROVE, IL


| Water year | Segment | Discharge code | Cumulative reservoir storage (acre-feet) | Urban fraction | Precipitation (inches) | Observed peak discharge (ft3/s) | Adjusted peak discharge (ft3/s) | Exceedance probability |
| 1961 | 1 | -- | 0 | 0.192 | 1.220 | 102 | 335 | 0.879 |
| 1962 | 1 | -- | 0 | 0.207 | 0.262 | 204 | 496 | 0.548 |
| 1963 | 1 | 4B | 0 | 0.222 | 0.087 | 55 | 239 | 0.967 |
| 1964 | 1 | 2 | 0 | 0.237 | 0.672 | 118 | 348 | 0.854 |
| 1965 | 1 | -- | 0 | 0.252 | 0.087 | 152 | 397 | 0.764 |
| 1966 | 1 | -- | 0 | 0.267 | 0.483 | 204 | 472 | 0.603 |
| 1967 | 1 | -- | 0 | 0.282 | 1.278 | 340 | 666 | 0.235 |
| 1968 | 1 | -- | 0 | 0.297 | 1.475 | 126 | 344 | 0.861 |
| 1969 | 1 | -- | 0 | 0.312 | 1.430 | 221 | 481 | 0.581 |
| 1970 | 1 | -- | 0 | 0.327 | 1.618 | 403 | 740 | 0.170 |
| 1971 | 1 | -- | 0 | 0.359 | 0.413 | 227 | 472 | 0.602 |
| 1972 | 1 | -- | 0 | 0.390 | 1.242 | 539 | 914 | 0.079 |
| 1973 | 1 | -- | 0 | 0.422 | 1.379 | 387 | 664 | 0.238 |
| 1974 | 1 | -- | 0 | 0.454 | 0.664 | 264 | 487 | 0.568 |
| 1975 | 1 | -- | 0 | 0.485 | 0.901 | 296 | 519 | 0.503 |
| 1976 | 1 | -- | 0 | 0.517 | 1.307 | 426 | 667 | 0.235 |

